echarts多y轴

展示图

根据条件type隐藏某一项(包括legend、鼠标悬停点弹框、坐标轴上相应隐藏)

1️⃣处理legend动态显示/隐藏某一项,包括图标

1
2
3
4
5
6
7
8
9
10
11
12
13
14
15
16
17
18
19
legend: {
top: '0',
left: this.legendLeft,
data: [
{ name: 'AAA' },
{ name: 'BBB' },
{ name: 'CCC', icon: type ? '' : 'none' }],
formatter: function(name) {
if (name === 'CCC') {
if (type) {
return name;
} else {
return '';
}
} else {
return name;
}
}
}

2️⃣处理鼠标悬浮点提示框动态展示问题

  • tooltip 提示框组件,其属性:
    · show:是否显示提示框组件,包括提示框浮层和 axisPointer
    · trigger: 触发类型,可选:

    • none : 什么都不触发
    • item : 数据项图形触发,主要在散点图,饼图等无类目轴的图表中使用
    • axis : 坐标轴触发,主要在柱状图,折线图等会使用类目轴的图表中使用(在 ECharts 2.x 中只支持类目轴上使用 axis trigger,在 ECharts 3 中支持在直角坐标系和极坐标系上的所有类型的轴。并且可以通过 axisPointer.axis 指定坐标轴。)
    1
    2
    3
    4
    5
    6
    7
    8
    9
    10
    11
    12
    13
    14
    15
    16
    17
    18
    19
    20
    21
    22
    23
    24
    25
    tooltips: {
    trigger: 'axis',
    formatter: function(params) {
    // 自定义提示框内容
    var tooltipContent = '';
    var mileConsumptionIndex = params.findIndex(param => param.seriesName === 'type1');
    var speedConsumptionIndex = params.findIndex(param => param.seriesName === 'type2');
    var oilConsumptionIndex = params.findIndex(param => param.seriesName === 'type3');
    if (mileConsumptionIndex !== -1) {
    tooltipContent += params[mileConsumptionIndex].name + params[mileConsumptionIndex].marker + params[mileConsumptionIndex].seriesName + ' : ' + params[mileConsumptionIndex].value + '<br/>';
    }
    if (speedConsumptionIndex !== -1) {
    tooltipContent += params[speedConsumptionIndex].marker + params[speedConsumptionIndex].seriesName + ' : ' + params[speedConsumptionIndex].value + '<br/>';
    }
    // 根据type判断是否需要展示
    if (!type && oilConsumptionIndex !== -1) {
    params.splice(oilConsumptionIndex, 1);
    }
    if (type && oilConsumptionIndex !== -1) {
    tooltipContent += params[oilConsumptionIndex].marker + params[oilConsumptionIndex].seriesName + ' : ' + (params[oilConsumptionIndex].value || '-') + '<br/>';
    }
    return tooltipContent;
    }
    }

· 其他属性看官网,官网地址tooltip

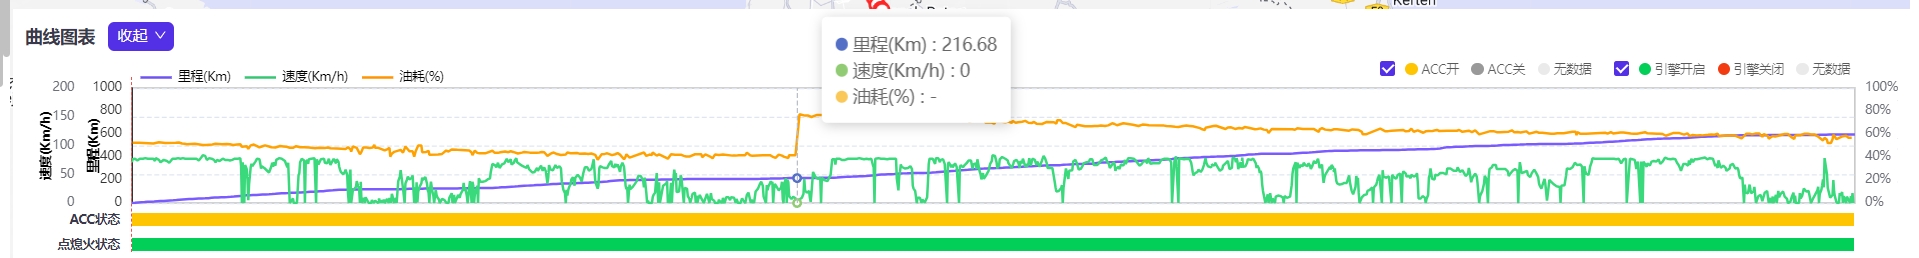
实现如下图所示,图1是没有type的,图2是有type的
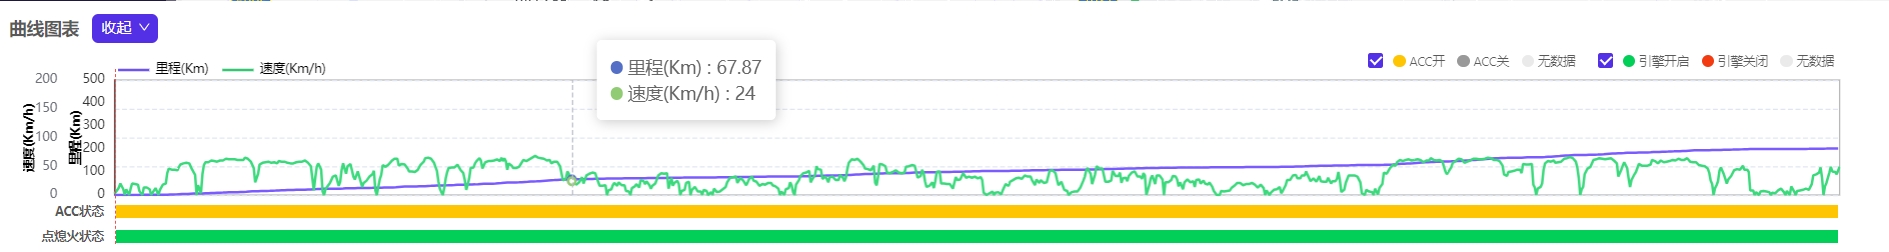
图1 图2

3️⃣处理坐标轴上相应的轴隐藏

1
2
3
4
5
6
7
8
9
10
yAxis: [
...省略其他项
{
name: 'AAA',
type: 'bar',
data: [],
... 省略其他配置
show: type // 根据条件`type`判断是否显示坐标轴
}
]

多轴显示问题,这里以多y轴为例

1、多y轴显示及顺序(❗⚠注:需要serieslegend的顺序保持一致,否则显示会有显示问题

1
2
3
4
5
6
7
8
9
10
11
12
13
14
15
16
17
18
19
20
21
22
23
24
25
26
27
28
29
legend: {
top: '0',
left: this.legendLeft,
data: [
{ name: 'AAA' },
{ name: 'BBB' },
{ name: 'CCC', icon: type ? '' : 'none' }],
...
},
series: [
{
name:'AAA',
type:'line',
...
yAxisIndex: 0
},
{
name:'BBB',
type:'line',
...
yAxisIndex: 1
},
{
name:'CCC',
type:'line',
...
yAxisIndex: 2
}
]

2、多轴标题旋转45度居中对齐问题,及标题文字样式设置,用到的是nameRotate nameLocation nameTextStyle

1
2
3
4
5
6
7
8
9
10
11
12
13
14
15
16
yAxis: [
{
name:'AAA',
type:'value',
...,
nameRotate: 90,// 旋转90
    nameLocation: 'middle', // 位于中间
    nameTextStyle: {
fontWeight: 'bold',
fontSize: 10,
align: 'center',
verticalAlign: 'middle',
color: '#000'
},
}
]

3、多y轴在同侧,这以左侧为例,需要用到的属性是position nameGap``offset

1
2
3
4
5
6
7
8
9
10
11
12
13
14
15
16
yAxis: [
{
name:'AAA',
type:'value',
position:'left',// 位于左边的y轴
nameGap: 30 // 标题和轴线的距离
...
},
{
name:'BBB',
type:'value',
position: 'left',
nameGap: 30,
offset: 20 // 距离'AAA'的距离
}
]

4、显示其中一个的分割线splitLine

1
2
3
4
5
6
7
8
9
10
11
12
13
14
15
16
17
18
19
20
21
yAxis: [
{
name:'AAA',
type:'value',
...
splitLine: {
show: false // 隐藏分割线
}
},
{
name:'BBB',
type:'value',
...
splitLine: {
show: true, // 显示且为dashed
lineStyle: {
type: 'dashed'
}
},
}
]

5、刻度线上的文字大小,显示类型

1
2
3
4
5
6
7
8
9
10
11
12
13
14
15
16
17
18
19
20
21
22
yAxis: [
{
name:'AAA',
type:'value',
...
axisLabel: {
fontSize: 10
}
},
...
{
name:'CCC',
type:'value',
...
axisLabel: {
fontSize: 10,
formatter: function(value) {
return value + '%';
}
},
}
]

6、不显示图表上的圆点

1
2
3
4
5
6
7
8
series: [
{
name:'AAA',
type:'line',
...
showSymbol: false // 隐藏点
}
]